Using the statistics module, it is possible to get reports about different metrics within the system. These reports could be a dynamic matrix, resembling a pivot chart or table, or they can be a list of objects. Additionally, statistics can have designed and implemented, one such is included with the FAQ add-on. These are Perl modules that have a specific use and are not configurable. Depending on which modules or add-ons you have within your system, additional statistics may be available for selection when creating a new statistic.
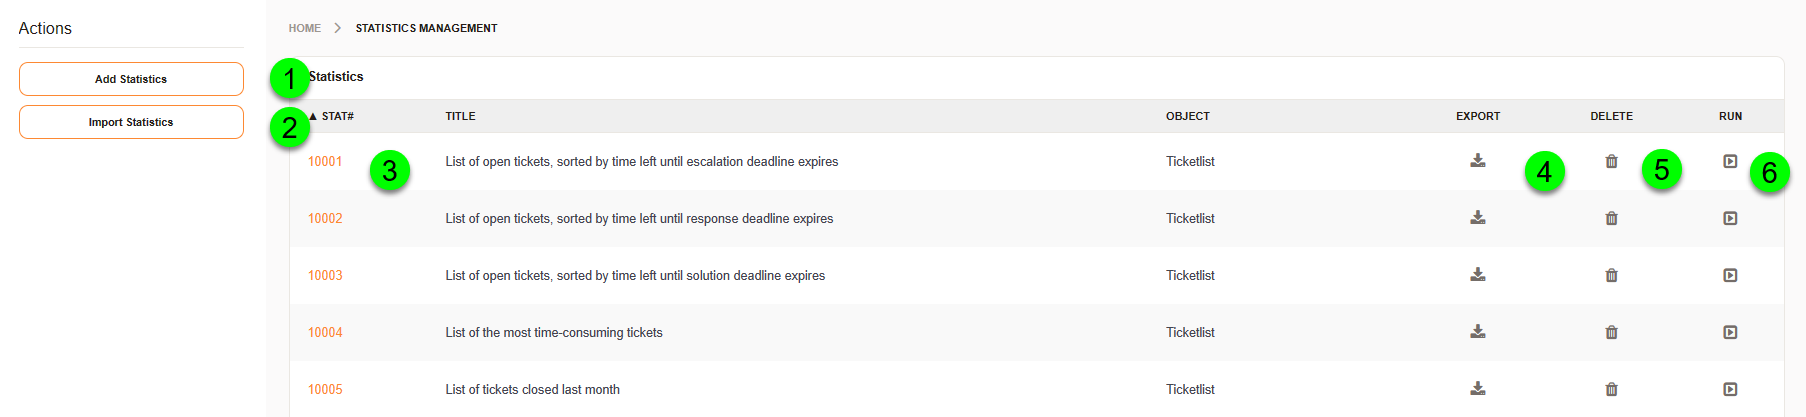
There are many statistics which are preloaded within your system. By navigating to agent statistics using the reports’ menu in the navigation area, you will see.a list of these predefined stats and be able to create statistics of your own.
Add
Import
Edit
Export
Delete
Run
Important
When importing and exporting statistics, IDs are used for entities. Make sure, that you change these in the YAML file, when importing into another system.
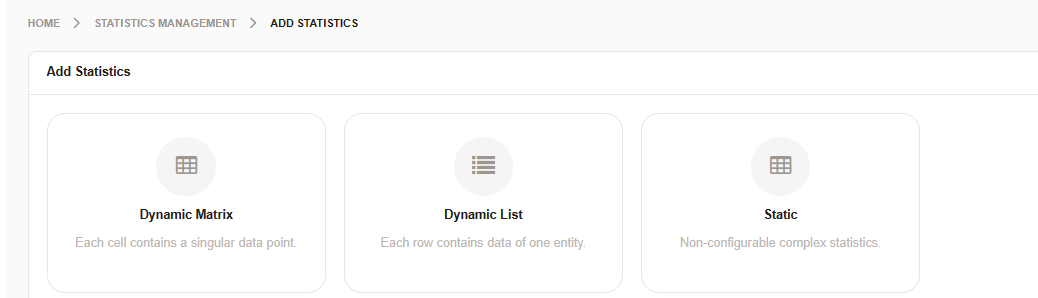
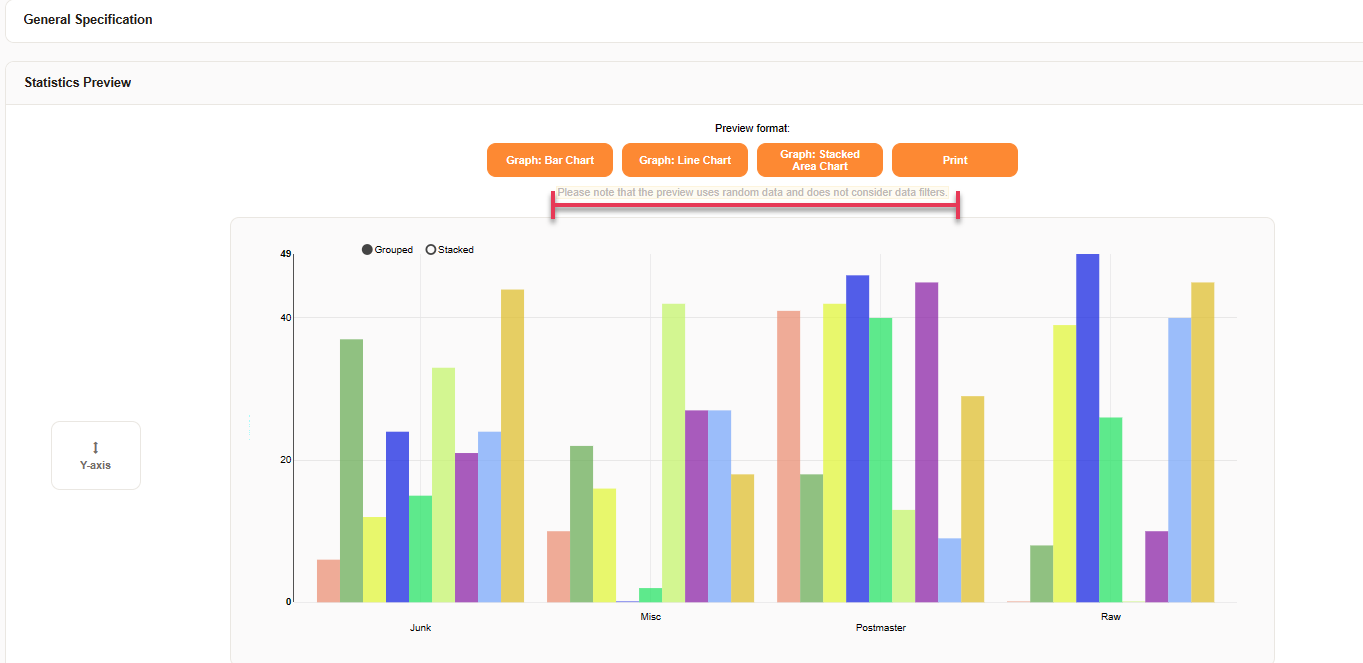
This report returns a bar, line, or pie chart. Also, you can get a CSV, or Excel file. It is possible to configure X and the Y axis, and filters, based on ticket data. These can also be selected for use as dashboard elements.
Dynamic list
The list returns tickets which meet, filter requirements. On the Y axis, you can set order and sort options. On the X axis, you can choose which attributes are returned.
Static
Nonconfigurable stats programmed in Pstats_agent_overviewrl can only be used once per time in your system
For each specific statistic type, you may select from one or more modules. Each module has a specific set of data it returns and calculations that it’s using. Depending on the module you have chosen, you may have more or less data included in your report and calculate. Calculations which you can use things like escalation reporting.
Statistic Type
Module Name
Description
Matrix
Ticket Accounted Time
The values show the total accounted time for matching tickets.
Matrix
Ticket Accumulation
The values show the total count of tiets matching tickets.
Matrix
Ticket Solution Response Time
The values show the average response time of matching tickets.
List
Ticket List
The list returns tickets and thier data.
Note
For more information about reselts generated by the DynamicList, see Statistics Attributes .
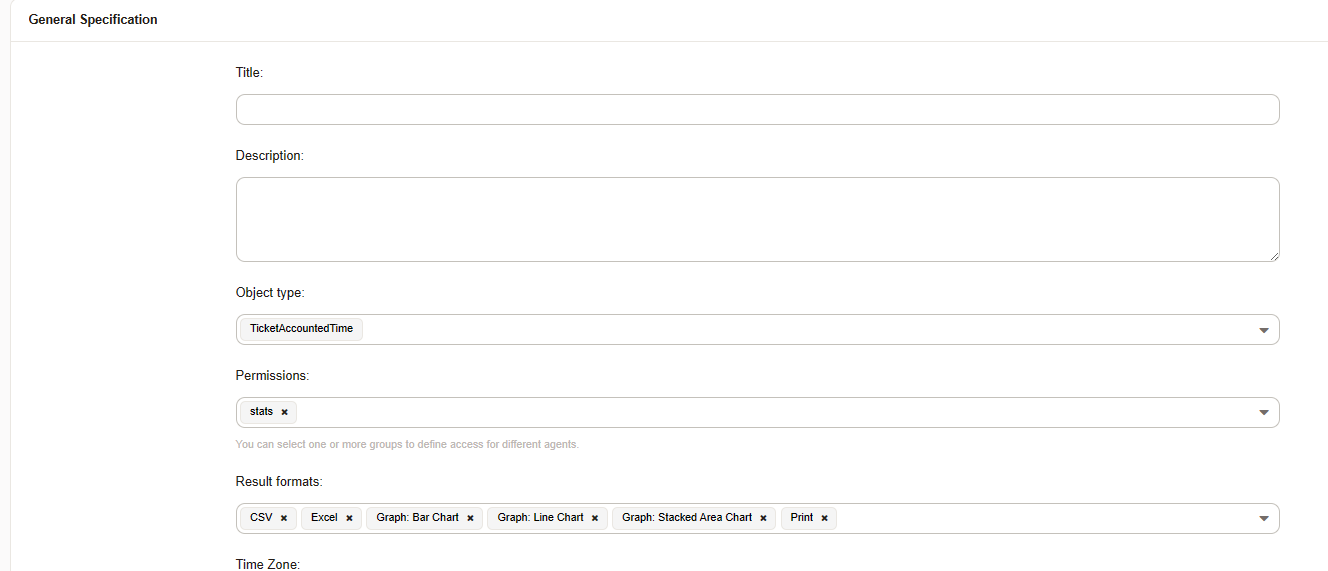
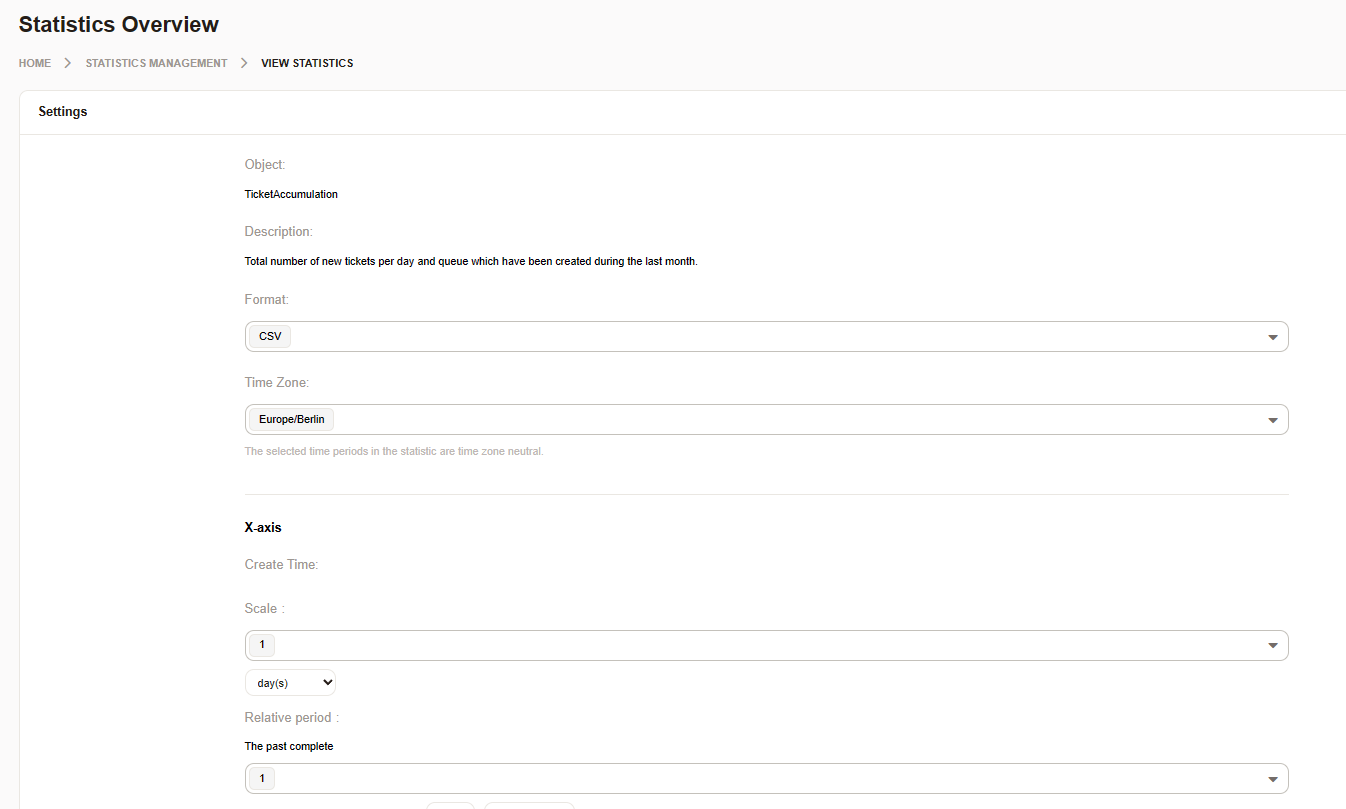
General information about the statistic must be added when creating or edtitng statistic.
Title
What’s the name of the report.
Description
Give more details about the report for an explanation about what the report should return.
Object type:
The object type allows you to choose which module should be used by the statistics to do the calculation and return the values. This can only be modified during statistic creation and cannot be edited.
Permissions
Set the groups who will be able to view and/or edit this report.
Results format
Choose the available result formats for the statistic module.
Time zone
Select the time zone for the report.
Create summation row
Add a summation row.
Create summation column
Add a summation column.
Cache results
Cache the results.
Show as dashboard widget
Should the report be available as a dashboard widget? (only charts can be used)
Configuration is first available after saving the general information. After this, you cannot change the Object type anymore. After saving, you can then configure the X and Y axis, and any filters.
Note
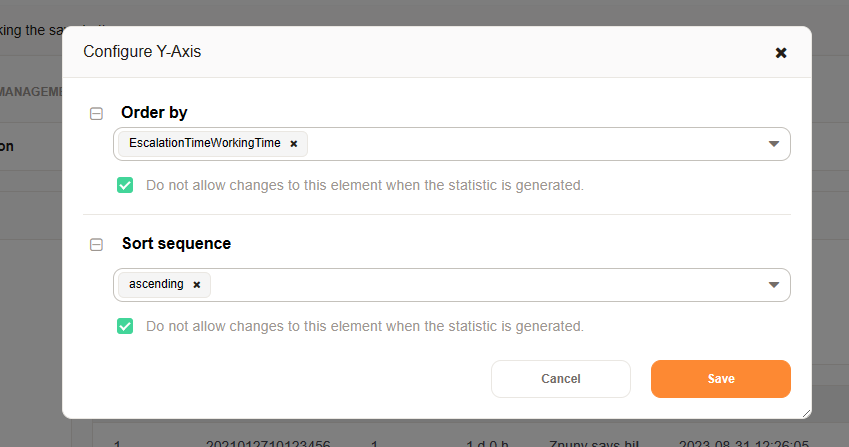
In the Dynamic Ticket List, the Y axis controls order and sorting.
<<<<<<< HEAD
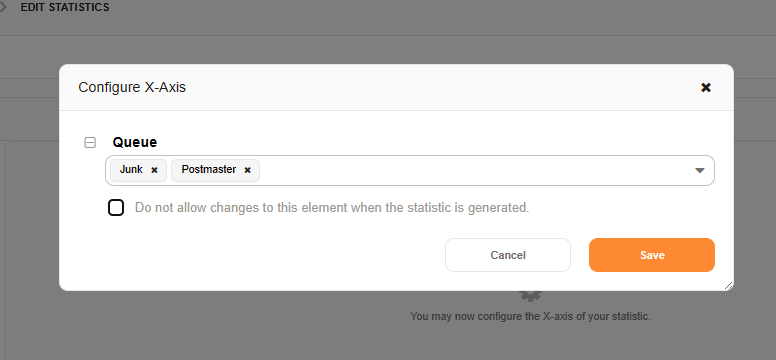
When you configure your X and Y axis or filters, you can choose to allow for changes at runtime, or not. If you do allow changes, only the values selected during stat creation will be available. To make all values available, leave the attribute list empty.
=======
When you configure your X and Y axis or fiters, you can choose to allow for changes at runtime, or not. If you do allow changes, only the values selected during stat creation will be available. To make all values available, leave the attribute list empty.
>>>>>>> znuny
Choose the statistic by selecting the statistic number or run in the Statistic Overview. You’ll then be offered the chance to change any settings the designer choose for you, or if you have write permissions you’ll be able to do a full edit on the statistic.