The OTRS statistics module holds features to track operational statistics and generates custom reports associated with OTRS usage. The OTRS system uses the term "statistic" generically to refer to a single report presenting various indicators.
Note
For OTRS Business Solution™ customers, there is also a reports generator available. Here "report" refers to a collection of several statistics in one PDF document that can be easily configured and automatically generated and distributed. Please find more details in the OTRS Business Solution™ manual.
Proper configuration of the OTRS statistics module is associated with a multitude of requirements and considerations. These include the various OTRS modules to be evaluated, user permission settings, indicators to be calculated and their complexity levels, ease of configuration of the statistics module, speed and efficiency of calculations, and support of a rich set of output variants.
Statistical elements, i.e. files which supplement the functionality of the statistics module for specific requirements, can be integrated for calculating complex statistics.
When signed on as an agent, the statistics module can be opened by selecting "Reports" and then "Statistics" in the main menu.
Selecting the "Statistics" link in the navigation bar, and then the submenu link "Overview", calls up the Overview screen. The Overview screen presents a list of all pre-configured reports the agent can use (see figure below).
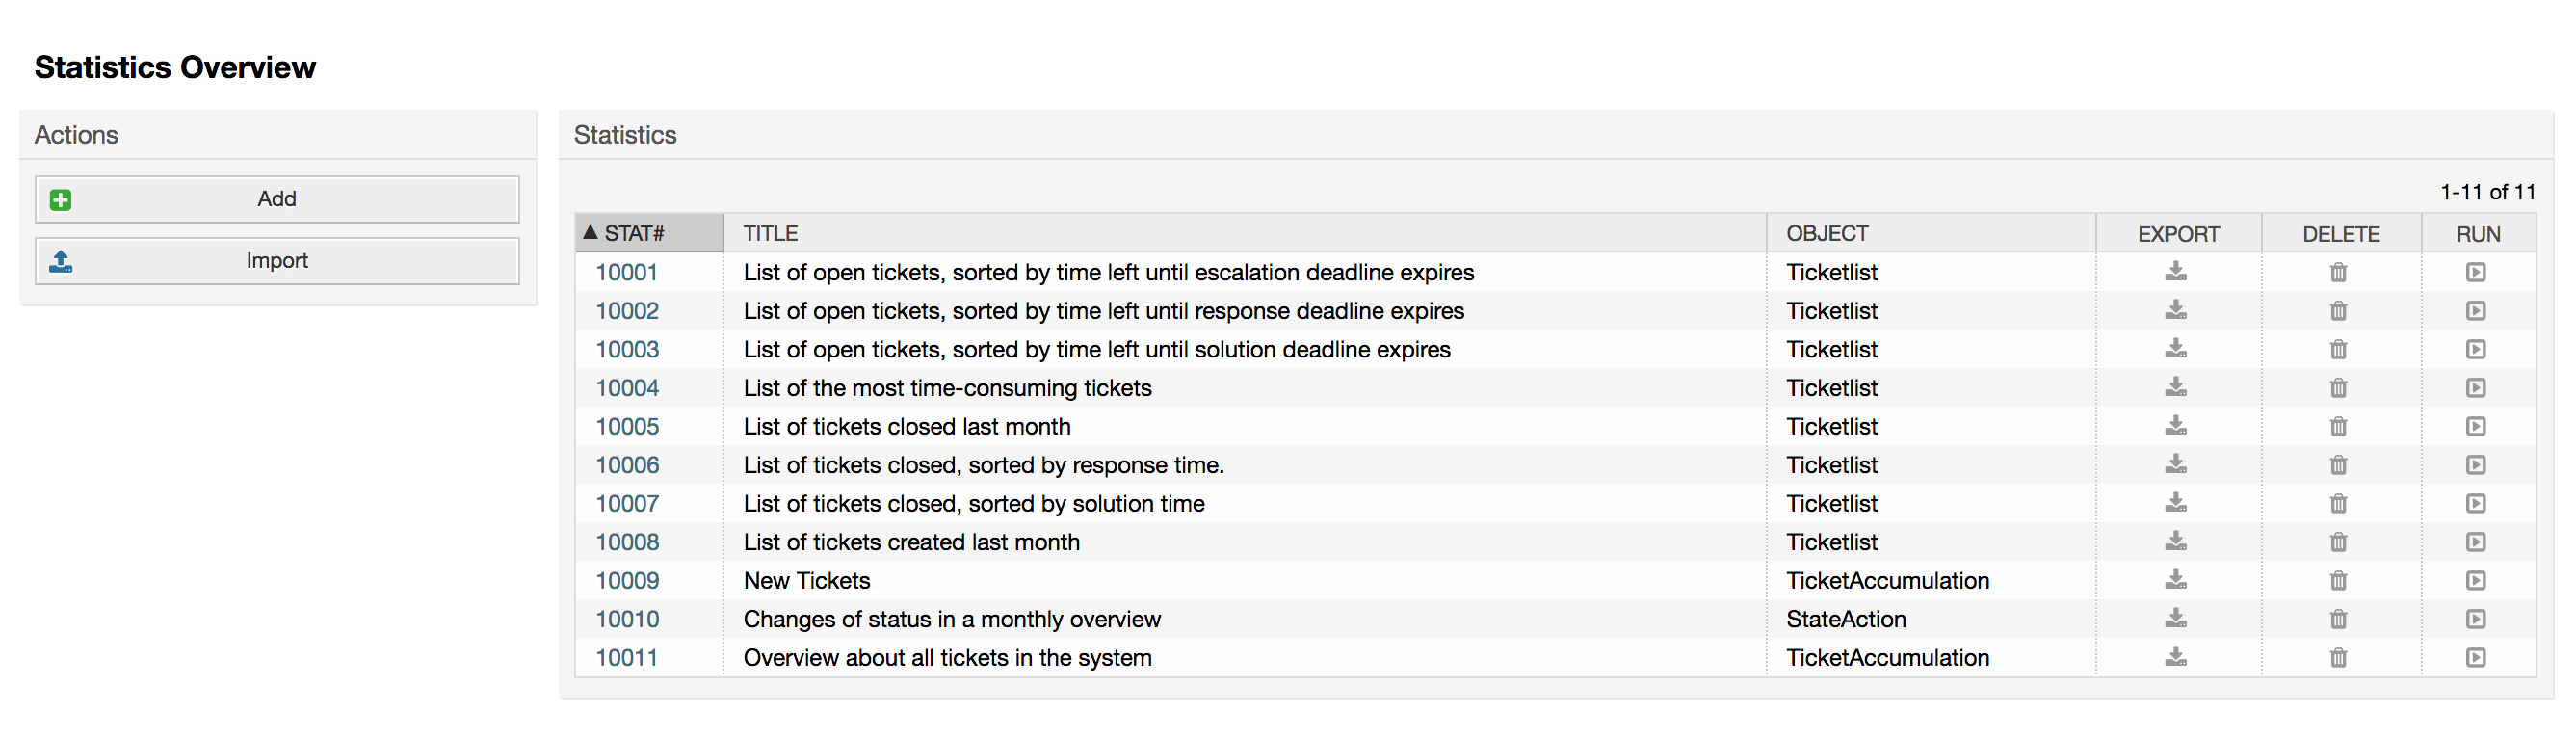
When the statistics module is installed, it comes preloaded with a few sample statistics imported into the system. These are shown as a list on the overview page. If the overview list extends to more than a single page, the agent can browse through the different pages. The list of statistics can be sorted as desired, by clicking the desired column header in the list. To generate a particular statistic, click on the statistic's "Run now" link.
The view user interface provides the stat's configuration settings (see figure below).
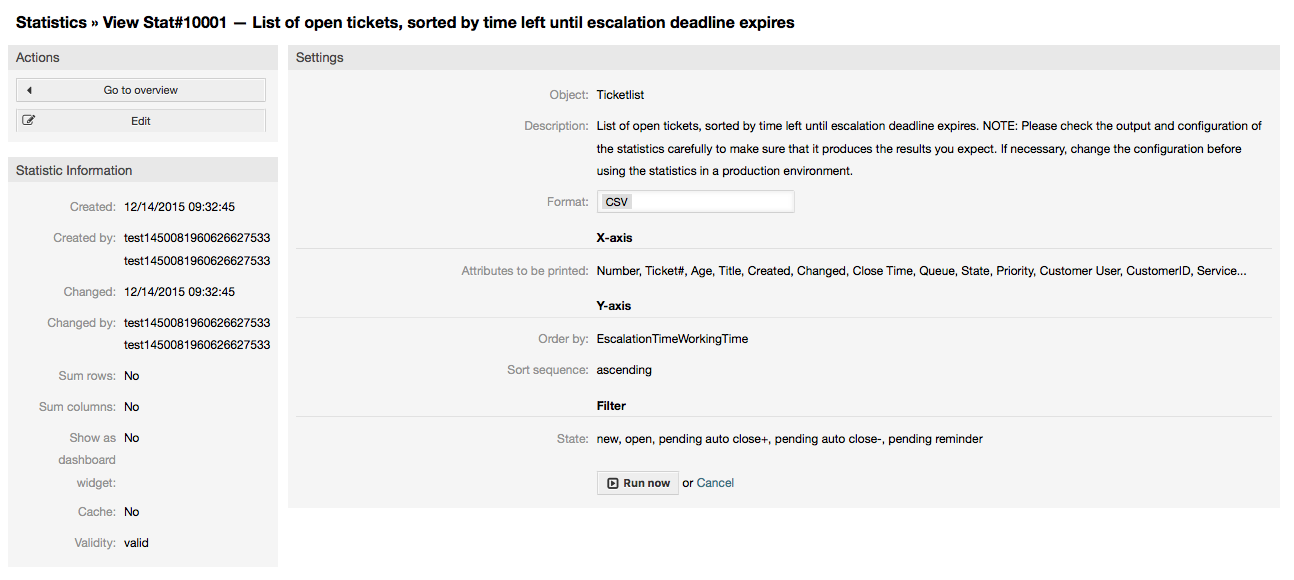
Configuration settings for a particular statistic can be set within the range of options in the View screen. Either the statistic creator or any others with the appropriate permissions can make the settings.
Pressing the "Start" button (at the bottom of the screen) is the last step to generate the statistic.
Agents with write rights can edit an existing report configuration by calling up the edit user interface of the statistics module. Alternately, they may create a new report.
There are four possible steps in the configuration of a statistic: the general specification data, configuring the x-axis, y-axis and possible data filters for the reported data (or restrictions). Let's create a new statistic as an example by clicking the "Add" button in the overview screen. Our goal will be to get an overview of how many tickets with very high priority are in every queue (x-axis) and state (y-axis).
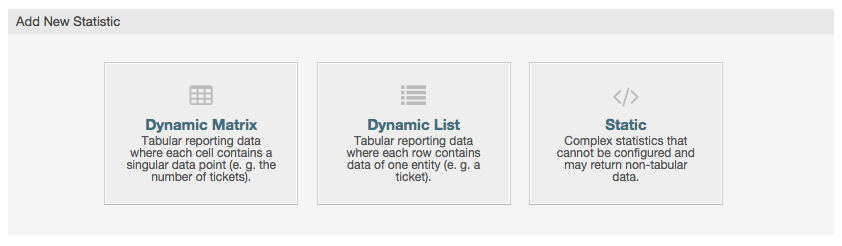
At the beginning we have to select the type of statistic we want to add. Three types are available:
- Dynamic Matrix Statistics
This type of statistics will generate a matrix of computed values (e.g. new tickets per day of month and queue). All value cells in the matrix have the same type (number, average time, etc.). Values are computed from entities in the system (e.g. tickets). Some matrix statistics support a summation column and/or row (only useful for certain data).
- Dynamic List Statistics
This kind of statistic will generate a table where every line (not cell) represents an entity in the system (e. g. a ticket). The columns in this row are usually configurable (x-axis, see below) and contain the data of this object (e. g. ticket attributes). All value cells in one column have the same type.
- Static Statistics
This kind of statistic is not very much configurable and usually used for very special and/or complex computations.
So let's select "Dynamic Matrix" for our example. Then the "General Specifications" configuration will appear below the statistic type selection.
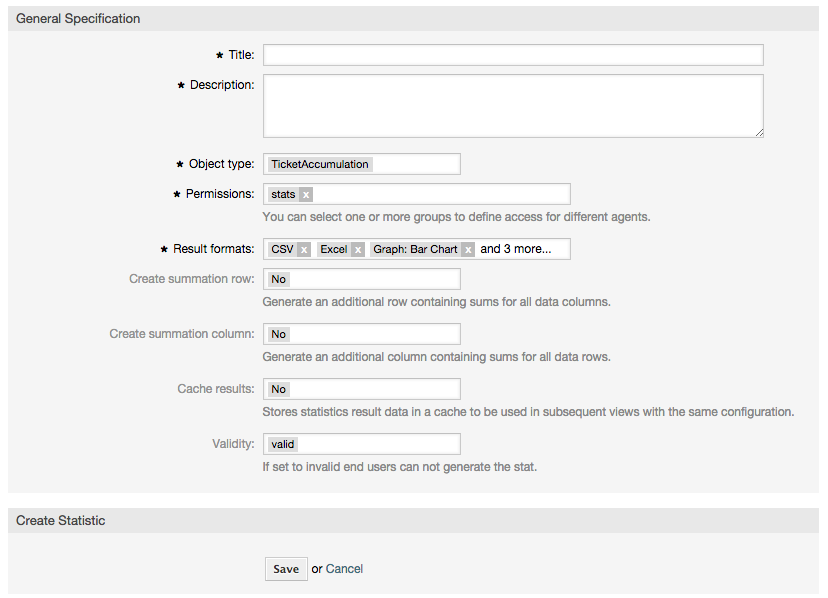
After providing a title and description for the new statistic, we have to select the statistics backend that we want to use. This is the actual backend module which is responsible to collect and analyze the data for our statistic. In our case we'll select "TicketAccumulation".
By configuring permission groups, we can facilitate a restriction of the groups (and therefore, agents) who can later view and generate the pre-configured statistics. Thus the various statistics can be allocated to the different departments and work groups who need them. It is possible to allocate one statistic to various groups.
Example 4.20. Default statistics permission group
The "stats" group was selected. The report is viewable for all users having at least ro rights for the "stats" group. This access is available by default.
Example 4.21. Customized statistics permission group
A group named "sales" was selected. All users with ro rights for the "sales" group can see the stat in the view mode and generate it. However, the report will not be available for viewing by other users.
Additionally, possible output formats can be selected. Here we can just keep all output formats and choose the one to use when actually generating the statistic. Let's save the statistic now.
The next screen will indicate the next step with a highlighted button: we should configure the x-axis. By clicking the button, a dialog will appear where we can select the element to be used for the x-axis. In our case that will be the queue:
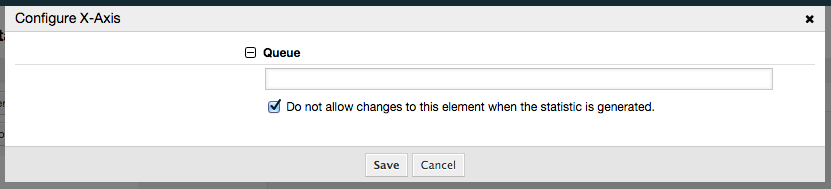
We can optionally limit the queues to be shown by selecting some in the queue field. With the checkbox we can control if the agent who generates the statistic can make changes to the queue selection. We'll keep the defaults and press "Save".
Now we can configure the y-axis in the same way: select the state field.
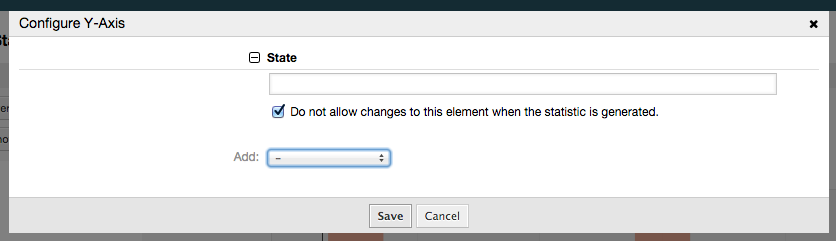
Here it is possible to select one element or two. In the first case, every value of the element will be one element on the y-axis. If two elements are selected, their permutations will be the elements on the value series. For example you could select "state" and "priority", and the resulting elements will be "new - 1 very low", "new - 2 low", ... "open - 1 very low" and so on. Let's just use the state and press "Save".
Now in the last step we could add data filters to only report tickets belonging to a certain customer, with certain priorities and so on. We'll add a filter for very high priority tickets:
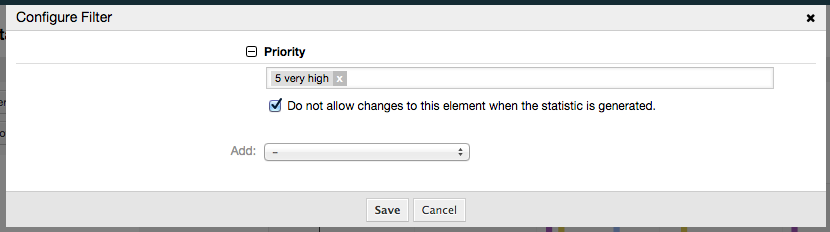
Now press "Save" again. The configuration is finished.
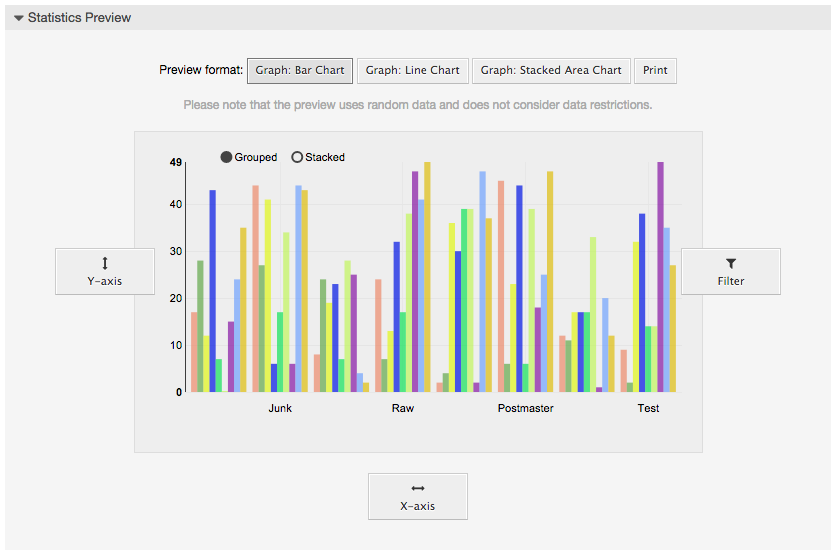
You may already have noted that in the configuration dialog there is a preview area where we can check the effect of our configuration settings.
Note
Please note that the preview uses random data and does not consider data restrictions.
The statistic is configured. By pressing the "Run now" button we can go to the View screen where the desired output format can be selected and the statistic can be generated in the different formats.
The Import user interface can be accessed by pressing the "Import" button on the Overview screen. "rw" permissions for the statistics module are required.
Facilitates the import of reports, and when combined with the export function of the module, is a very handy functionality. Stats can be created and tested conveniently on test systems, then imported into the production system.
This section provides information about the tasks and responsibilities of the OTRS administrator dealing with the statistics module.
The default configuration of the module registration gives all agents with "stats" group permissions access to the statistics module.
Access according to permission settings:
rw. Allows configuring statistics.
ro. Permits generating pre-configured statistics.
The OTRS administrator decides whether agents with the permission to generate pre-configured reports are allocated ro rights in the "stats" group, or if their respective groups are added in the module registration in SysConfig.
The SysConfig groups Core::Stats and Frontend::Agent::View::Stats contain all configuration parameters for the basic set-up of the statistics module. Moreover, the configuration parameter $Self->{'Frontend::Module'}->{'AgentStats'} controls the arrangement and registration of the modules and icons within the statistics module.
Statistics can be generated on the command line with the command bin/otrs.Console.pl Maint::Stats::Generate.
As an example, see the command line call in the following script.
shell> bin/otrs.Console.pl Maint::Stats::Generate --number 10004 --target-directory /tmp
Generating statistic number 10004...
  Writing file /tmp/List_of_the_most_time-consuming_tickets_Created_2015-09-08_14-51.csv.
Done.
A report from the statistic configuration "Stat#10004" is generated and saved as a CSV file in the /tmp directory.
The generated report can also be sent as an e-mail. More information can be called up with the command in the script below.
shell> bin/otrs.Console.pl Maint::Stats::Generate --help
It usually does not make sense to generate reports manually via the command line, as the statistics module has a convenient graphical user interface. However, generating reports manually does make sense when combined with a cron job.
Imagine the following scenario: On the first day of every month, the heads of department want to receive a report for the past month. By combining a cron job and command line call the reports can be sent to them automatically by e-mail.