Debugging and Logs#
When searching for errors, you will need to know where to search. Here are the different Logging mechanisms in Znuny.
Application Log
Communication Log
Daemon Log
Web server Log
Web service Log
Application Log#
Where to find it?
The default setting is for the LogModule is Kernel::System::Log::SysLog. This will log to your operating system’s logging service, if available.
How to configure it?
Navigate to Admin -> System configuration
Search for
LogModuleSelect the configuration settin
Click Edit this setting
You can modify the option to use Kernel::System::Log::File
Application Log options#
File#
Increase logging efficiency with LogModule::LogFile::Date. This extends the log file name with a date, and creates a new log for each month.
Use the setting LogModule::LogFile to determine where you log file should be located.
Important
The Znuny and web server user must have write access to the directory.
SysLog#
If logging to the syslog, you can:
Set the
LogModule::SysLog::FacilityChoose the
LogModule::SysLog::Charset
General#
General options for both logging methods:
CGILogPrefixSpecifies the text that should appear in the log file to denote a CGI script entry
MinimumLogLevelSet the minimum log level. If you select ‘error’, just errors are logged. With ‘debug’ you get all logging messages. The order of log levels is: ‘debug’, ‘info’, ‘notice’ and ‘error’.
Communication Log#
The communication log is used to view information for incoming and outgoing connections.
How to access?
As an administer, You can access the communication log:
Navigate to Admin -> Communication Log
Select the Communication Log Admin LogModule
Administration Module#
Additionally, each mail communication contains a link to the associated entry in the communication log.
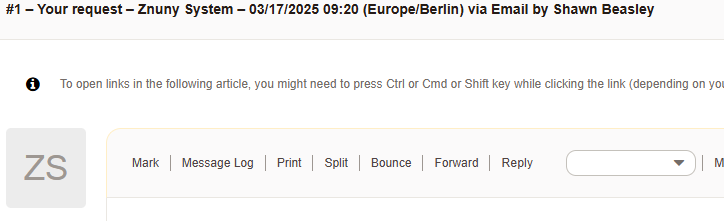
Link in Article to Communication Log#
Overview#
Features
✅Filter for communication log entries
✅Analyze connection issues
✅Review header and message processing
✅Identify unsent messages
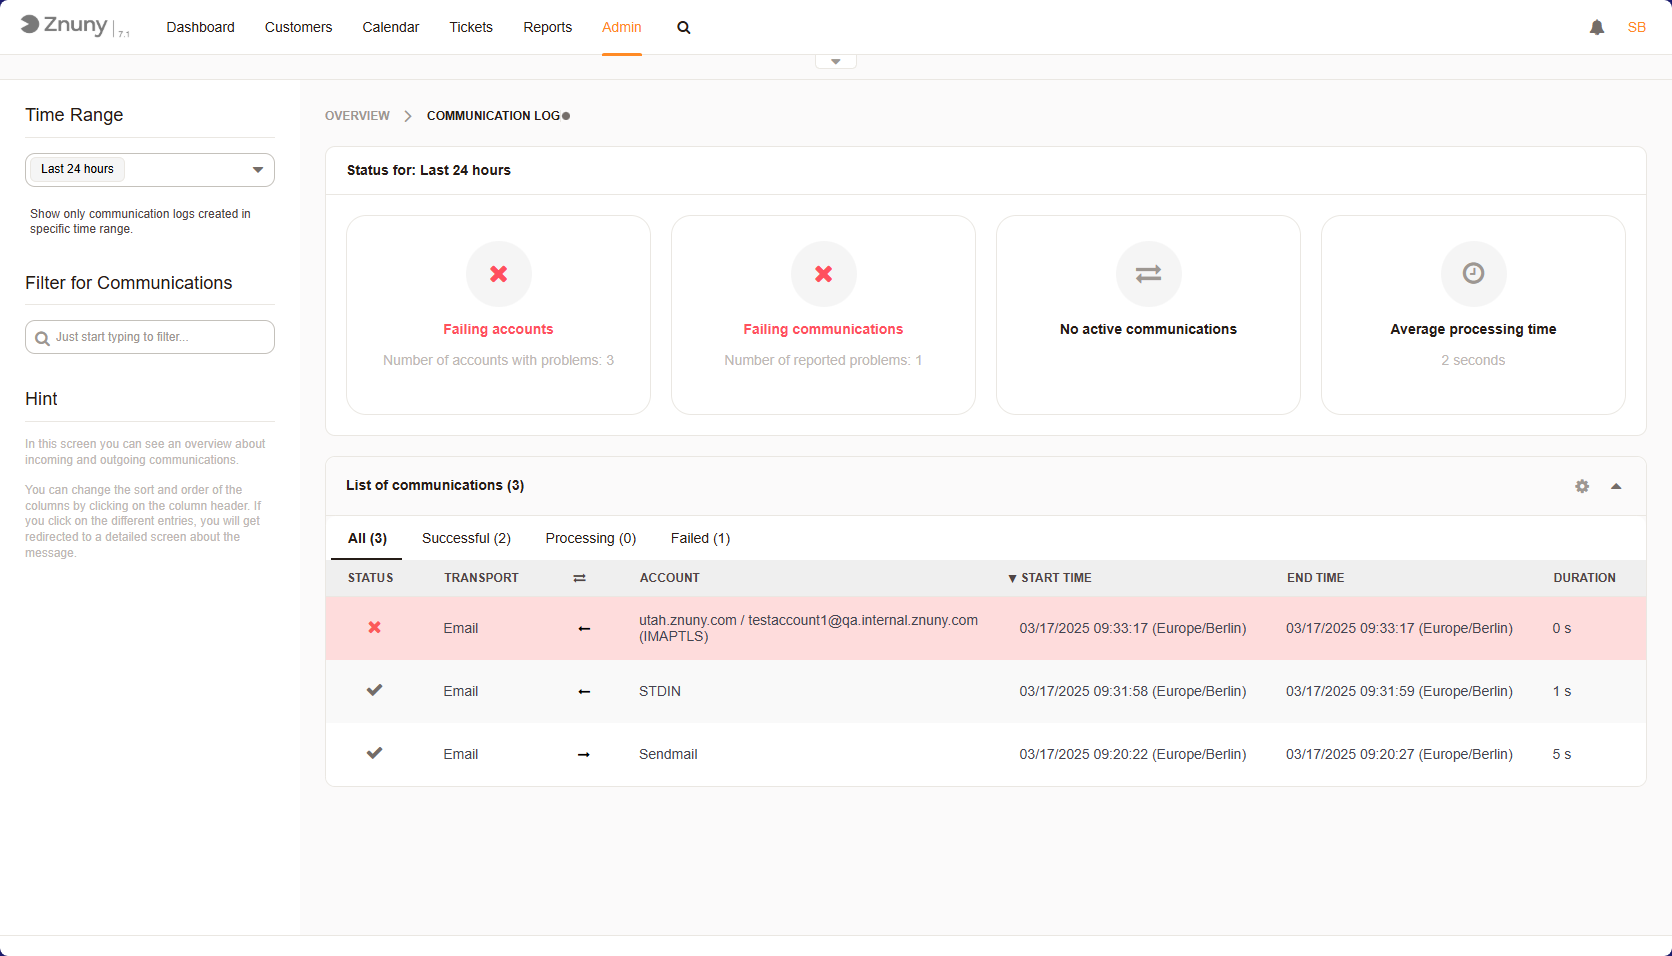
Communication Log Overview#
In the overview, the most important categories of message log entries can be seen.
Daemon Log#
This log is located under var/log/Daemon/ and every time a task logs an error it save it to an individual log.
The logs are associated with the type of Daemon Task.
SystemConfigurationSyncManagerERR.log -Errors which occurred during synchronization of the system configuration when using multiple front-end nodes.
SchedulerFutureTaskManagerERR.log -Errors which occurred during planned future tasks.
SchedulerCronTaskManagerERR.log -Errors which occurred during regularly run tasks.
SchedulerTaskWorkerERR.log -Errors which occurred during asynchronous tasks.
SchedulerGenericAgentTaskManagerERR.log -Errors which occurred during tasks run as a generic agent.
Web Server Log#
For configuration and access to the webserver log, contact you system administrator.
Web service Log#
The web service log aids in identifying issues during configuration and normal operations. As with the normal system log, the order of log levels is: ‘debug’, ‘info’, ‘notice’ and ‘error’. To access the error log:
Navigate to Admin -> Web Services
Select you web service i. e. GenericTicketConnectorREST
Select Debugger from the Actions block in the left sidebar.
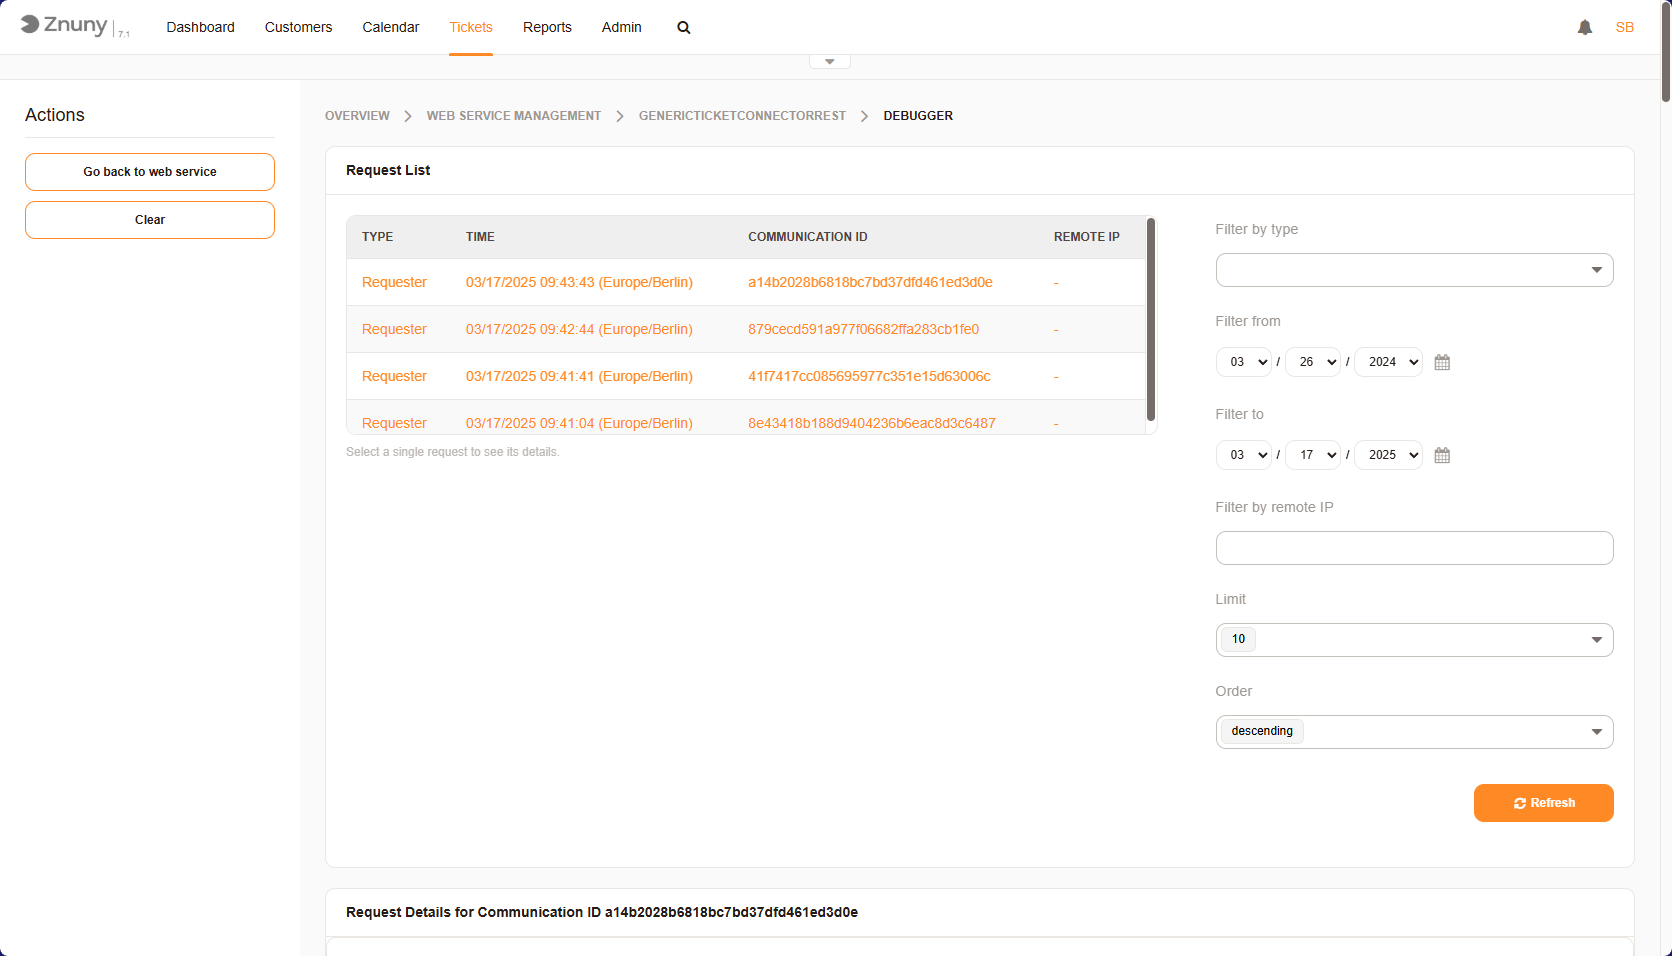
Web Service Debugger Overview#
Features
✅Filter for web service request and provider log entries
✅Analyze connection issues
✅Review mapping results
✅Verify data sent or received
Selecting an entry will allow you to see the following details (depending upon log level and request type).
Communication sequence start Date and Data.
Received data by provider (Type Provider)
Detected operation (Type Provider)
Used Invoker (Type Requester)
Outgoing and Incoming Data: - Pre-Mapping - Post-Mapping
URI after interpolating URI params from outgoing data (Type Requester)
Remaining outgoing or incoming data (helps with xml conversion by non-conventional tags)
Request parameters (Type Requester)
JSON Data received
Error Data
Error Handling Information
Returning provider data to remote system (Type Provider)
Error Messages generated by Operations prior to mapping.
Important
Taking size and frequency into account, it’s best practice not to run an active webserivce on log level debug.